Weekly Pit Futures Review

Monday, December 13, 2010

James Mound’s Weekend Commodities Review

Financials

The S&P500 has developed an interesting multi-pronged technical setup on a daily chart that indicates a strong decline to 1203, possibly as low as 1184 in the near term. I believe the stock market rallied based on the Obama extensions of the Bush tax cuts, but overall the market will find weakness in global economic concerns and a reversal in premature bond selling. As money migrates back into the U.S. dollar from a continued exodus in Europe it is more likely funds will pour into bonds than an overbought stock market. Expect a dollar run to 83, a 3-5% drop in stock prices, and a decent bond retracement to 126 over a relatively short time frame. The euro and pound remain sells with the Canadian and Aussie dollar worthy of long term shorts. The Japanese yen remains a bull bright spot amid a sea of bearish foreign currency plays, with money moving to Japan as it leaves Europe and investors lack alternatives. I continue to stand by my forecast that:

Grains

Corn, wheat and soybeans have all developed congestion patterns near the highs, not altogether a bearish indicator but rather a suggestion that momentum and upside volatility have subsided. My expectations for declines in the stock market and energy sector are likely to hit the grain sector as well, given the lack of fundamental influences in grains this time of year and the overall psychology that global economic weakness means declining grain demand. Put plays are recommended across the board.

12-12-10 beans.jpg

Past performance is not indicative of future results.

**Chart courtesy of Gecko Software's TracknTrade

Meats

Cattle is testing key trend line support and should fail this week. Hogs remain choppy and avoidable for the time being.

Metals

Gold and silver remain near the highs with choppy intermittently volatile trade lacking clear near term direction. Get short heading into the last few weeks of 2010 as a liquidation event is expected in both markets in the near term. Copper offers a fundamental long term sell ahead of a China slowdown causing panic selling in that market.

Softs

A short covering rally in coffee appears underway, however this move (possibly to 230) is expected to be short-lived and worthy of a put play on a further move up. Cocoa has established a likely near term top and is a sell with straight long puts. Cotton is attempting to pull off the miraculous feat of new highs after such a dramatic collapse. This is unlikely to occur, mainly on a technical level as it is very rare to see epic highs followed by an extreme retracement followed by a rapid return to the highs. Instead, look at this as the market setting a secondary top for a less volatile selloff ahead. OJ is a short with puts. Sugar is a sell using bear put spreads. Lumber remains a cycle buy on dips.

Wednesday, November 24, 2010

Soybeans Futures History

Although there are several claims to the origin of soybeans, most believe its roots can be traced back to Asia. More specifically, the history of soybean use for human consumption goes back at least 5,000 years in the Chinese culture. Soybeans were proclaimed as a “sacred plant” by Chinese Emperor Shennong. If anyone was to claim a particular crop as sacred it’s Shennong. His name directly translates to “divine farmer” and he’s often referred to as the Emperor of Five Grains for his contribution to Chinese agriculture.

Fast forward a few thousand years to the early part of the 1930s; the U.S. is recovering from the Great Depression and the droughts of the Dust Bowl. At the time, Ford was doing more than building cars. A little known fact about Henry Ford is that he was one of the biggest proponents of soybeans’ uses. His financial contributions to the research of soybean applications directly assisted in the development of products like soymilk and soy-based fibers. Soybean markets were growing, and a proper place to trade them was becoming a growing need.

In 1936, the Chicago Board of Trade (CBOT), the first formal futures exchange in the United States, launched its futures contracts for trading soybeans; the first of its kind. Another product of 1936 was the Commodities Exchange Act that banned futures trading on non-designated exchanges. By consolidating soybean trading under one roof, the soybean futures market grew. These developments solved two large issues facing producers and consumers of soybeans. Having a futures exchange allowed for buyers and sellers of soybeans to meet and trade their goods resulting in proper price discovery. The futures market gave an accurate price reference for those who needed one. The other major issue that existed before exchanges was the lack of accurate supply and demand data. This resulted in supply gluts and shortages because producers weren’t able to properly assess demand needs. Formalized futures exchanges not only consolidated trading, but they also consolidated market data.

15 years after trading soybean futures markets began, the CBOT introduced futures on the soybean complex: soybean oil and soybean meal. Options on soybean futures products were released in 1984. These different products have all developed and grown in their own rights. They are widely used by spreaders, hedgers, speculators, and commercials. The historic development of futures markets are the reason that people trading soybean markets today have the versatility and choice to pick which financial vehicle suits them best.

(Soybean. Columbia Encyclopedia, Sixth Edition. 2001-07. Accessed Feb.25, 2009)

(Jane Reynolds, Phil Gates, and Gaden Robinson (1994). 365 Days of Nature and Discovery. Harry N. Adams, Inc., New York. p. 44. ISBN 0-8109-3876-6. )

(CBOT: About CBOT: History)

Trading in futures and options involves a substantial degree of a risk of loss and is not suitable for all investors. Past performance is not indicative of future results.

Wednesday, November 17, 2010

The Bullion Report : The Gold-Silver Ratio

The gold-silver ratio is among the many tools and topics that investors take a hard look at when it comes to precious metals. There are several moments in time that the ratio was made a permanent force by government decree. Even in modern trading, the ratio has a home in certain trading strategies. With both markets playing with record highs, it is worth explaining and exploring the ratio between these two markets.


Past performance is not indicative of future results.
***chart courtesy Gecko Software’s Track n’ Trade Pro


Past performance is not indicative of future results.
***chart courtesy Gecko Software’s Track n’ Trade Pro

The gold-silver ratio is pretty straightforward math – to determine the ratio, look at how many ounces of silver it takes to buy a single ounce of gold. If gold were trading around $1,000 an ounce and silver around $20 an ounce, the ratio would be 1,000 over 20 or 50:1. The result is that a higher ratio is seen as a signal for cheaper silver versus gold and a high ratio signals more expensive silver. Older references regarding the mining resources for silver suggest that there is roughly 16 times more silver to be mined than gold, which sets up the older ratio valuations from countries like France, the US, and Great Britain. Today, the values for both metals are obviously constantly changing, but adherents to trade strategies based on this ratio look at historical references for potential trading opportunities.

Coinage acts in the United States during the 18th and 19th centuries placed the gold-silver ratio in the neighborhood of 1:15 or 1:16. When the bimetal standard was dropped, this shifted and the ratio has drifted high and low in subsequent generations. Events like the Great Depression, the implementation of Bretton-Woods, post-war prosperity, dropping of the gold standard, the Hunt Brother’s manipulation, and other price extremes in precious metals have been cited as significant shifts in the ratio.

Trading strategies based on the gold-silver ratio look at these previous ratio levels as possibilities for extremes which might present opportunities. Basically, if it takes fifty ounces of silver to buy one ounce of gold at one point, an investor who thinks the ratio may expand would look to sell or be short silver-related assets. There is still a substantial level of risk in the trade, and it would be based on the ability to correctly identify an opportunity in the ratio and the potential for a future shift. Trading the ratio can be done through various investment outlets. Some bullion bugs trading the ratio may do so without regard to the actual prices. In the same example, if an investor believed the ratio would expand from 50:1, they could convert 50 ounces of silver to one ounce of gold. If the silver price dropped and the ratio grew to 100:1, the same investor could convert that ounce of gold to 100 ounces of silver.

Using an average price for each precious metal, a chart of the gold-silver ratio over time might look a little like this:


Past performance is not indicative of future results.

To ratio traders, the suggestion of this chart is that extremes run the gamut from around 16:1 to nearly 100:1. The last decade has frequently produced numbers around 50:1 or 60:1. Therefore, any divergence from this could be viewed as a potential trade.

Summary


The gold-silver ratio is obviously another tool that can be employed by investors looking for particular signals when trading precious metals. The current analysis suggests that when compared to the rest of the decade, a ratio above 50:1 means greater opportunities in long silver positions. However, the extreme volatility seen as of late might mean the ratio has room to expand. There are also the recent lawsuits regarding silver price manipulation to consider. Most importantly, the current recession has yet to push towards a tangible recovery. This means that silver could still be highly susceptible to larger price movements to the downside as it is used in both industry and investment. The precious metals investment expansion could still see strong demand this year and next. The manufacturing industry might not. That means there is a possibility of a fundamental weakness in silver markets that needs to be accounted for when looking at the gold-silver ratio. If gold can retain its strength or outperform silver at any time, the downside pressure in the silver market might easily deliver another spike in the gold-silver ratio.

For your FREE gold trading kit, call (866)258-5997.

It means that the silver coins of the United States at whatever ratio is fixed, and I want the present ratio that we have now, 16 to 1, maintained precisely as it is. -Richard Parks Bland


Disclaimer: The prices of precious metals and physical commodities are unpredictable and volatile. There is a substantial degree of a risk of loss in all trading. Past performance is not indicative of future results. © 2010 Berkshire Asset Management, LLC

Monday, November 8, 2010

PitGuru.com’s Weekly Grains Review for Nov 8th, 2010

Friday saw a messy session with wheat and bean oil leading the way higher on relationship buying ahead of the report. Oil share widened on Chinese demand talk and possible production concerns coming out of Indonesia following the recent volcanic activity. There is no wipeout talked about but the light ash cover is coating leaves restricting photosynthetic activity. This is a concern for total production in a time of tightening global food oil supply. Wheat recovered from chart lows versus corn with protective buying seen in options. The WZ 750-800 call spread was bought all day with the WZ 750-775 call spread bought a couple thousand times. The most interesting play is in corn options with paper buying the CH 10.00 calls, the CK 11.00 calls and the CZ11 10.00 calls. This is obviously a gamma and slope play with delta a mute point with calls this far out of the money. Outside of this the market is seeing puts bought in bean oil as players start looking for the downside technical correction. Owning put vol covered is a smart way to play the put slope inversions with long futures helping counter the upside delta move. All in all a very supportive week with the market inching closer to key strike prices as the Dec option expiration approaches. Heading into the weekend the trade is asking itself, what comes next? What happens if the USDA lowers corn yield below 154? What if John Macintosh is correct and corn yield is 148? Is China’s recent absence from the bean export market the first piece of evidence that they are now covered through March? Will the USDA raise bean exports 50 million bushels and if so, where do they get the extra beans? Do they borrow from the “residual” sludge fund or are they going to raise the yield? Bean ending stocks, though larger than last year, are still too low to be comfortable making the trade jittery.

The weekend offered little fresh information leaving the trade erratically choppy heading into the November report. Early strength was seen in the wheat market with this trade seeing a 20-cent range overnight after weekend weather did not offer any relief to the US plains or NW Australia. The macro situation overnight was slightly weaker with nothing dramatic but a slight contraction erased early overnight gains in grains. All markets ended slightly lower with bean oil losing the most following a contraction in palm oil. The USD is gaining versus the Euro on growing concern over Irish debt levels with this looking to continue into the day session.

The day ahead of the report is usually a protection day. This is when traders with naked length or shorts look to buy options as an insurance policy for immediate movement. Look for hefty action in Dec options again today, following the action the market saw on Friday. With the information currently at hand the trade is looking for a drop in overall corn yield, no change to a minor increase in bean yield with world wheat numbers expected to fall again. Overall this report should offer plenty of opportunity for the trade to change their bias if they want to. The “spin” following the trade will be interesting in that pundits are polarized at the momentum concerning the actual impact fundamentals will have versus the impact of the USD. I am a fundamental trader so I feel this will be fundamentals will win the day, if not tomorrow then the market has to wait for the final numbers on the WASDE report come January.

The market looks to open slightly lower to start the day with a weaker crude market and a sizable (100+) move in the USD over the Euro. All factors look bearish heading into the report but do not get enamored with bearish sentiment until we get tomorrow’s numbers behind us.

I am currently in Cartagena Colombia at an international conference of wheat producers and consumers. Following the conference I hope to have a better idea of what the actual world producers are looking for concerning protein, production and overall producer sentiment. From early indications I estimate that the world crop will be big but overall quality is a concern making the wheat versus corn spread a feature following the WASDE report.

World production numbers are going to be closely scrutinized. Focus on Argentina, Brazil, Australia, Russia and look for possible changes in the Chinese numbers. The USDA is currently 16 MMT above private forecasters concerning Chinese corn production so I think this a possible bomb about to go off. The direction of the impact following the grenade is yet to be seen but I have to believe that the upside is the path of least resistance for corn and all agricultural markets due to growing world consumption and questionable weather patterns. The La Nina effect is stated to be the largest in 70 years. If this is true, the Latin American crops are in for a tough struggle as planting approaches completion.

Wednesday, November 3, 2010

High Marks

Today the markets eagerly anticipate an announcement from the Federal Reserve as it wraps up a two day meeting. The focus will fall on the full measure of proposed quantitative easing. Heading into the report, there has been little doubt that the Fed will take some easing measures and that the US dollar and metals markets will react. So far this year, gold and silver have made fresh highs, reigniting interest into the high marks of the past and the events that motivated them.


Past performance is not indicative of future results.
***chart courtesy Gecko Software’s Track n’ Trade Pro

Past performance is not indicative of future results.
***chart courtesy Gecko Software’s Track n’ Trade Pro

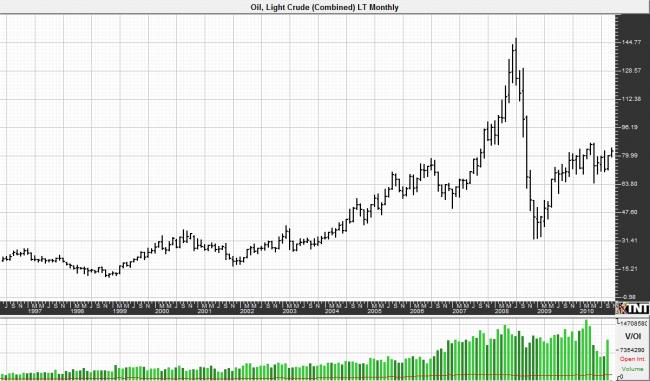
The fundamental focus for the last few years has been relatively narrow, falling on a handful of US dollar events and a broad picture of the global economic landscape. The housing and credit crisis precipitated reactions from the Federal Reserve that led to easing and a drop in the US dollar. Subsequent economic fallout including high unemployment and stagnant growth led some investors to the ‘haven’ of precious metals as an alternative asset. This has continued to bring some high price levels in both gold and silver.

The march to new highs in gold was nearly three decades in the making. In 1980, the price of gold topped $850 amid a climate of high inflation, high oil prices, and high geo-political tensions, specifically in Afghanistan. The price of gold tumbled following that peak, apparently bottoming out above $250 an ounce in 1999. The low came in as investors speculated that central banks would begin selling their gold reserves. Once the central banks of Europe signed their gold agreement limiting gold sales, the stage was set for a price comeback.


Past performance is not indicative of future results.
***chart courtesy Gecko Software’s Track n’ Trade Pro

In the decade that followed, gold prices picked up steam, gathering momentum as geopolitical tensions began to rise and commodities prices picked up. Starting in 2006, the weakening dollar provided a likely catalyst for investors to move towards commodities. The subsequent price peaks in gold hit a climax in January of 2008 when gold broke that $850 price high. Each new high shook out some investors as profit taking ensued, but the market forged ahead to the $1,000 an ounce level, breaking through in March of that same year. After that, gold prices appeared to fall victim to the commodities exodus as investors began to focus on demand fundamentals and the potential for recovery. Plenty of stimulus was being poured into the global economy in an effort to restart the growth engines, and it appeared to have the potential to work.

However, gold came back after falling below the $700 level. Investment interest and demand, especially in ETFs, grew exponentially last year. That kind of hunger for the perceived haven of gold propelled the market back over the $1,000 mark and beyond. For now, gold has already managed to top $1,380, and there appears no shortage of analysts who thing the twin threats of inflation and fear could move things higher.

Gold prices have not stood alone in hitting fresh highs. Silver has also managed to break out, topping previous high marks. However, cresting the all-time peak in silver prices could be a little more challenging. The peak price in silver took place in the 1980s under the price manipulation of the Hunt Brothers. At that time, silver prices could have been faring reasonably well in tandem with gold as fundamentals like inflation and political tensions affected commodities priced in US dollars. However, the exponentially high silver spike above $50 had some help from the Hunt’s cornering the market. Once the chase had ended, the Hunts were bankrupt and many speculators suffered huge losses.

Finding a high mark in silver prices absent of manipulation, it would seem natural to take a look at the prices in 2008, when gold and other commodities were logging price peaks. In March of that year, silver prices topped $20 an ounce. This level was only recently breached again. Unfortunately, this new high comes as more accusations of manipulation come into play. CFTC commissioner Bart Chilton recently issued a statement that suggests they are looking into the potential that there were attempts to influence silver prices. (1)


Past performance is not indicative of future results.
***chart courtesy Gecko Software’s Track n’ Trade Pro

Summary

There seems to be little doubt that the recent economic crisis and the reaction to the same have helped propel precious metal prices higher. Gold, as well as silver, have been the beneficiaries of renewed interest from investors. As a result, prices gained a great deal of momentum and hit fresh highs. Going forward, it seems that there is plenty of room for price action on both sides of these high marks. On one hand, the new peaks are likely to inspire intermittent profit taking. On the other hand, the bigger picture could spell strength and support for these markets. What it comes down to is the strength of the fundamentals behind the move. Price highs based solely on fear and manipulation face a greater challenge in finding support on the way down. Those are weaker fundamentals. Gold and silver prices would need to find strength in the possibility that investor and central bank demand for gold will remain vibrant and that the US dollar will remain in a pattern of competitive devaluation.

For your FREE gold trading kit, call (866)258-5997.

1 http://www.bloomberg.com/news/2010-10-26/silver-market-faced-fraudulent-efforts-to-control-price-chilton-says.html

Gold and silver are no doubt subject to fluctuations, from the discovery of new and more abundant mines; but such discoveries are rare, and their effects, though powerful, are limited to periods of comparatively short duration. - David Ricardo

Monday, November 1, 2010

Pitguru Review for November 1st: Energies & Metals


Energies
By PitGuru Daniel Cronin

Crude Oil still stuck in this trading range but after this week the market will have much better direction on where it wants to go after the FOMC meeting and the non-farm payrolls at the end of the week. Crude has been stuck between $80 and $84 for the last month now but speculation over the weekend led that the Federal Reserve will announce another round of credit-easing measures to help spur growth in the U.S helped the Euro rally and crude as well above $82 per barrel. WTI spreads have gained in recent days and so has the market down from support at $80.50. I believe the market will rise up to the resistance of $82.70 today before any news comes out, and then it’s all fair game from there. $84.50 definitely can be tested if credit ratings ease even further so keep an eye out for this number.

Natural gas has been on a real surge since the November contract came off the board. December Natural is now above $4.08 looking to test key resistance of $4.10 as this market has shot up since consecutive inventory reports have come out better than expected. This market looked to be headed to $3.00 but after the depressed November contract went off the flood gates opened up and buyers came in chomping at the bit to get a piece of the market. For now it needs to see a nice close above $4.10 to continue momentum.


***chart courtesy Gecko Software’s Track n’ Trade Pro
Past performance is not necessarily indicative of future results.

Metals

By PitGuru Daniel Cronin

Gold and Silver both have rallied since being semi liquidated the last two weeks as new buyers came into the market as the Euro rallied against the USD ahead of the FOMC meeting this week. Per Bloomberg, “Precious metals have gained this year as central banks maintained low interest rates and governments spent trillions of dollars to spur growth. Silver has advanced 48 percent in 2010 and palladium has surged 60 percent, both beating gold’s 24 percent rise. Precious metals have outperformed global equities, Treasuries and most industrial metals, boosting investment in exchange-traded products backed by the metals.” (1) I think an easing of the rate will surely send Gold up above $1,365 and Silver past $25.00 as these markets already have momentum behind them - another positive for them will only send these to higher heights.

Copper rallying back up to $3.80 from last week’s low of $3.71 amid the FOMC meeting as both equities and Euro rise. $3.92 is key resistance so this market will be watching out and waiting in anticipation of the Fed's next move. For now markets are trending higher but can be thrown for a loop if the Fed decides not to do anything and should unemployment rise, sending Copper back to $3.71.

1 http://www.bloomberg.com/news/2010-1...s-meeting.html


Thursday, October 28, 2010

The Learn About Futures Insider for Oct 28th, 2010: Crude Oil

The Learn About Futures Insider:
Crude Oil


Sometimes mythic, often controversial, crude oil has been an important component of modern times. Crude oil comes in many colors and consistencies, from hydrocarbon rich reservoirs in Texas to the heavy oil sands of Canada and Venezuela. Usually named for their region of production as well as other factors, crude oil properties can include various elements including carbon, nitrogen, oxygen, sulfur, and metals. Due to international appeal and demand, there are different tradable crude oil contracts across the globe, but for the purposes of this report, specifications willl focus on the NYMEX Light, Sweet crude oil contract.

Contract Size:1,000 US barrels or 42,000 gallons

Price Quote & Tick Size:Dollars and cents per barrel; minimum tick size is one cent per barrel or $10.00 per contract

Contract Months: All months

Trading Specs: Open outcry on NYMEX runs from 9:00 am to 2:30 pm ET. Electronic trading on Globex runs Sunday through Friday 6:00 pm until 5:15 pm with a 45 minute break each day.

Daily Price Limit: $10.00 per barrel or $10,000 per contract. If any contract is traded, bid, or offered at the limit for five minutes, trading is halted for five minutes. When trading resumes, the limit is expanded by $10.00 per barrel in either direction. If another halt were triggered, the market would continue to be expanded by $10.00 per barrel in either direction after each successive five-minute trading halt. There will be no maximum price fluctuation limits during any one trading session.

Trading Symbols: CL


Past performance is not indicative of future results.
***chart courtesy of Gecko Software

Crude Oil Facts
Crude oil is not limited to modern uses as history shows examples of petroleum products being applied for nearly four thousand years. However, there is no doubt that the volume of consumption and the variety of applications for crude oil exploded in the middle of the nineteenth century. First driven by the demand for kerosene and oil lamps, the introduction of the internal combustion engine sealed crude oil's fate and ushered in the era of oil booms across the United States. As oil quickly overtook coal as the world's leading fuel, it was only a matter of time before reservoirs began to be outpaced by demand and the first "energy crisis" hit in the 1970's. In the 1980's, increased production and lower demand led to an "oil glut".

US imports in the last three decades are illustrated as follows:

Past performance is not indicative of future results.
**Data Courtesy of EIA

The most well known deposits of petroleum are porous rock formations in which the hydrocarbons that make up the oil are sealed within the rock by an impermeable rock above. These reservoirs are accessed by drilling and pumping. Unconventional oil deposits of heavy crude oil exist in oil sands or oil shales which contain migrating oil or trapped hydrocarbons. Heavier crude oil deposits are often more expensive or require a more intensive process to extract the oil.

Most geologists attribute the formation of oil to the compression and heating of organic materials over extremely long periods of geologic time. However, there is an alternate theory that suggests natural petroleum was formed from deposits which may date to the formation of the earth rather than biological origins.

World crude oil supply and demand stats are highlighted in the following:

Past performance is not indicative of future results.
**Data Courtesy of EIA


Past performance is not indicative of future results.
**Data Courtesy of EIA

Past performance is not indicative of future results.
**Data Courtesy of EIA


Past performance is not indicative of future results.
**Data Courtesy of EIA

Key Terms

Crack Spread - Based on the word cracking which is the word for breaking down crude oil into products at a refinery. A crack spread is a term used when referring to the price difference between crude oil and extracted products like gasoline or heating oil.

Light, sweet or sour crude oil - Oil comes in various colors and viscosities. Light, sweet crude oil has less sulfur and is lighter than sour crude oil. Light, sweet crude oil is usually in higher demand for refining into gasoline, kerosene and diesel.

Oil sands or tar sands - are semi-solids of crude oil, sand, and water. Usually sticky, sands need to be extracted in unconventional ways since they do not flow like those deposits used with well methods. Big deposits include Athabasca oil sands in Canada and Orinoco oil sands in Venezuela.

Key Uses

Crude oil is normally taken to refineries for the hydrocarbon chemicals to be distilled into the common products consumers are all familiar with or to be mixed with chemicals to create other products including:

Diesel fuel
Gasoline
Jet Fuel
Kerosene
Natural Gas
Lubricants
Tar
Paraffin

Key Concerns

Hubbert Peak Theory - A geologist working for Shell Oil in the middle part of the last century is widely recognized as the first person to predict an oil peak. M. King Hubbert noted that oil discoveries tended over time to form a bell shaped curve. He suggested that oil production over time would follow a similar path with production in the lower 48 states peaking between 1965 and 1970. Hubbert went on to predict global oil production would peak in the last five years of the 20th century.

Using his predictive curve, it appears as though 54 of the largest oil producing nations have already passed their peak of production and are in decline. However, controversy surrounds the theory since many regions lack transparency in accounting for oil reserves. Conclusions vary from intimating that the global peak has already passed to the optimistic notion that the peak will come in 2035. Fossil fuels are defined as finite and since supply can be a major factor when considering pricing - if not the most important - the implications of the theory are boundless.

OPEC - The Organization of Petroleum Exporting Countries (OPEC) is a group of thirteen oil producing nations: Algeria, Angola, Ecuador, Indonesia, Iran, Iraq, Kuwait, Libya, Nigeria, Qatar, Saudi Arabia, the United Arab Emirates, and Venezuela. Created in 1960 and with current headquarters in Vienna, the stated objective of OPEC is to coordinate and unify member petroleum policies to secure fair and stable prices. Actions, statements, and policy changes from member nations can have an immediate impact on the price of oil and meetings are usually foreshadowed by media and trader speculation.

Geopolitical Tensions - Disputes and conflicts in any producing nation will naturally have an effect on oil prices . The Gulf War and the War on Terror are probable examples as they centered on top producing regions of the world. Smaller - though no less grave - incursions in or around oil pipes, oil pumps, and oil refineries in areas of Asia and Africa can also affect production, distribution, and price.

Alternative Fuels/Environmental Concerns - Controversy surrounds petroleum products and is rooted in the potential harmful effects to the environment and atmosphere. The late 20th and early 21st centuries have focused on producing alternative fuels and engines. They have also seen significant environmental issues ranging from oil spills to the impact of drilling in preserved areas. Alternately and perhaps ironically the effect of the environment on oil production is a key area for concern especially during the Gulf hurricane season when offshore platforms become natural targets and production is pared back or halted completely. The same effect can be felt during winter storms in the North Sea.
_______________________________________________________________________________________
Disclaimer: There is a substantial risk of loss in futures trading and it is not suitable for all investors. Losses can exceed your account size and/or margin requirements. Commodities trading can be extremely risky and is not for everyone. Some trading strategies have unlimited risk. Educate yourself on the risks and rewards of such investing prior to trading. Futures Press Inc., the publisher, and/or its affiliates, staff or anyone associated with Futures Press, Inc. or www.learnaboutfutures.com, do not guarantee profits or pre-determined loss points, and are not held monetarily responsible for the trading losses of others (subscribers or otherwise). Past results are by no means indicative of potential future returns. Fundamental factors, seasonal and weather trends, and current events may have already been factored into the markets. Options DO NOT necessarily move lock step with the underlying futures contract. Information provided is compiled by sources believed to be reliable. Futures Press, Inc., and/or its principals, assume no responsibility for any errors or omissions as the information may not be complete or events may have been cancelled or rescheduled. Any copy, reprint, broadcast or distribution of this report of any kind is prohibited without the expressed written consent of Futures Press, Inc.

Wednesday, October 27, 2010

The Bullion Report for Oct 27th: At Ease

The Federal Reserve will be meeting next week and all eyes will be focused on the potential for another round of monetary easing. Speculation abounds as to the scope and depth of their actions, but most analysts are working on the assumption that at least $500 billion in Treasuries will be picked up over the next five months. Considering the global economic climate and the link between gold and the U.S. dollar, what could this easing mean for precious metals moving forward?


Past performance is not indicative of future results.
***chart courtesy Gecko Software’s Track n’ Trade Pro

Easing is a banking tool that is meant to stimulate economic activity. The Federal Reserve would aim to do this with a round of Treasury purchases. This would keep them on their current course of reducing interest rates and trying to jumpstart the money supply. With these purchases, they get excess reserves to make new money. The effect can be what the name implies – it gives the banks and the economy some breathing room.

The risks to easing run the gamut between the potential for hyperinflation and the chance that the easing will not be long or deep enough to achieve the desired stimulus results. In the present environment, both situations would likely represent a bane to the Federal Reserve and a boon to gold and other precious metals.

Debasing the U.S. dollar by increasing the money supply would likely spur additional interest in gold and other precious metal investment. After all, inflation serves to devalue a regular savings account. The trick to this, and the hope of the Federal Reserve officials who support this course of action, is that the global stage will negate the effect of this round of easing. Basically, if all the other central banks are doing it, there will be no one single losing currency. This kind of “competitive devaluation” might temper the reaction from the market. The caveat is that the increase in money supply on a global level would still be a possible motivator for investors who jump on gold as an inflation hedge.

Even if the inflation-situation does not come into play, or it is successfully combated, there is still an overwhelming amount of debt created by round after round of stimulus aimed at spurring economic activity. This has increased the demand for certain investments – like gold – amid flimsy fundamentals for other financial assets. It will probably mean more business for precious metals as investors seek havens if the stimulus fails and this second round of easing isn’t enough to bolster employment and economic growth.

It will be interesting to see what the Federal Reserve commits to, following next week’s meeting. Guesses seem to be centered on the possible commitment from officials to buy up $100 billion in Treasury debt per month for the next five months. This headline may already be priced into the markets, but recent gains in the dollar set up an interesting situation. The drop in gold prices on the strengthening U.S. currency could have set up perceived value entry points ahead of any additional official announcements. According to a story from Reuters, gold traders in India were already scooping up the metal on lower prices amid their festival and wedding season peaks. (1)

It seems unlikely that the Federal Reserve will fall short of the market expectations. Doing so at this point would bump up the dollar but it would jolt other financial markets in the process. Officials have not been working this hard for this long to rock the boat, despite some member objections to another round of stimulus. To quote Ben Bernanke’s own speech from the beginning of 2009, “The global economy will recover, but the timing and strength of the recovery are highly uncertain.” With this in mind, the effort they could be announcing next week will probably fall in line with their actions thus far. Commit to maintaining a response that adds liquidity and stimulus but keep the door open. This means giving a nudge and a wink but not committing to huge purchases right away. Look for officials to nibble at easing, not gobble.

Summary

There is probably no quick fix to housing and employment issues, but there has been strong effort to repair things since the 2007 start of the crisis. The cumulative efforts of the Federal Reserve could see results at some point, after all, employment is seen as a lagging indicator of the health of an economy. However, until there is a solid compass point that shows tangible recovery and economic strength, fear will still prevail. Fear of economic troubles and fear of future inflation issues as a direct result of continuing stimulus. This means that there is still a proverbial basket of issues from which investors can pull a potential catalyst for higher gold prices.

For your FREE gold trading kit, call (866)258-5997.

As we move towards 8 or 10 billion people on the planet, there's a little less gold per capita. Each one of us will continue to be fighting over an ever smaller percentage of total resources. This is not a happy thought. - Dean Kamen

1 http://economictimes.indiatimes.com/...ow/6821101.cms

To register to receive this report FREE via email, please visit http://newsletter.berkshireassetmgt.com

Monday, October 25, 2010

PitGuru.com Weekly Grains Review for Oct 25th

By Matthew Pierce

Friday saw a choppy lower session with both corn and beans following the script gravitating back to the highest open interest strikes at $5.60 and $12.00. This kept most of the trade subdued throughout the session with nothing exciting on the fundamental side to direct interest ahead of the weekend. There was little expected so the trade allowed options to dictate the pace. Over the weekend I saw 4364 of the SX 12.00 calls exercised with 226 puts abandoned…a good move in hindsight. In corn I saw 3016 calls exercised and 5568 puts. The puts were thought to have futures against them. These were the only two features with all other floor commodities showing only marginal interest in Nov. The overnight session was dictated by macro factors with the USD taking another dive following nothing coming out of the G20 meeting. Crude is up on extreme food oil demand with palm screaming higher making 2 year highs. Chinese markets were higher as well helping the corrective upside sentiment. The day session looks to open in line or stronger than the overnight with support from the Euro, Chinese demand, Aussie weather and now talk of standing water delaying plantings in the SW of the US HRW region.

Today’s calls are as follows: Beans are called 15-20 Higher looking at the contract high at 1235 (SF) as the first bull target. Corn is called 10-12 Higher looking to go above Friday’s high with last week’s high at 579 ½ the first upside target with the contract high at 588 offering a second level this week. Indicators remain in the upper end of the range but are still below the contract highs. Wheat is called 7-10 Higher looking to achieve the 50-day MA sitting at 702 ½ this week. Meal is called 2-3 dollars Higher looking at last week’s contract high at 340.20 as the only target. Bean oil is called 130-150 Higher leading the way on the floor looking to achieve the 50% weekly retracement level at 49.77.


Concerning weather: Weekend rains were far greater than expected in the SW region of the US with many areas that needed rains receiving them for HRW plantings. This system moved slowly across the Midwest with all harvest activity stalled. This should ease the record rate seen for this year’s harvest allowing time to catch up with the markets. There is some talk of too much rain in areas of N. TX, NE OK and SE KS but this is not a major factor yet. The benefit of the overall rains outweighs the spotty standing water. The above map shows a bearish forecast with only the far NE corner of the Corn Belt still looking at any rains to stall harvest. Looking at Australian weather, the NW’s opportunity for rain is stunted today as compared with Friday’s forecast. The forecasted rains have been pushed off to this weekend with fading confidence in the overall impact this will have. Without these rains Aussie NW production will fall to less than 50% of last year’s crop. China is looking at a very cold forecast possibly damaging their recently planted winter grain crops with wheat a serious concern. This is a short lived situation but one that deserves watching due to wheat corn relationship spread levels.

Looking ahead at this week I see commodity demand as the major factor. Chinese demand in particular is the focal point of the trade with continued rumors floating all over the trade that a major corn deal is in the works. This only enhances the availability of profit in long option and volatility plays heading into Month End. I expect to see more and more OI hitting the trade as moving into Nov due to profit potential versus a staggering US equity picture. The retail sector looks to suffer even though estimates are above last year. The 5-year trend remains low and slow not offering any incentive to join the party. On the other hand, commodities continue to gain in open interest; commodities have a real supply and demand story coupled with massive world currency issues. This train is just warming up for all late comers.


***chart courtesy Gecko Software’s Track n’ Trade Pro
Past performance is not necessarily indicative of future results.

Pitguru Financials Review for oct 18, 2010

By PitGuru Frank LaMantia

Citigroup earned $2.15 billion compared to a loss of $3.24 billion last year at this time. It is still owned by the government but shares are being sold back slowly. Currently the government owns about 12% of the company and wants to be free of the company by year end 2011. Bad loans are down 30% for the past quarter to $7.66 billion which could mean consumers may be getting control of personal finances. (1)

This trader mentioned that buyout and mergers may jump this quarter. Not every company is struggling and when one company falls another takes its place. Survival of the fittest has been how Wall Street worked over the past 100 years. But since 2007 government aid, bailouts, and the too big to fail attitude has changed this motto. Northeast Utilities is purchasing New England Energy for $4 billion in stock and St Jude Medical is buying AGA Medical Holdings for $20.80 per share. The company is also taking over $220 million of debt but is taking over a rival company. (2) (3)

Industrial production was announced down -0.2% and was forecasted to be up 0.1%. Capacity Utilization came in as expected at 74.7%. Tuesday housing starts and building permits are both forecast to come in at 550k. On Wednesday Mortgage Applications which came in at 14.6% at the last announcement will be released; along with Crude Inventories. Many will be looking at Thursday’s initial jobless claims which are forecast to be 450k. Also leading indicators will be released and expected to be around 0.3%. (4)

Apple will be announcing earnings after the close which could propel the market overnight. IBM is also a name that one should be watching to see if the markets will take kindly to the numbers. This week earnings and language used by the Fed could give a more clear direction on where this market is headed. Obviously, the market is stagnant at technical levels previously discussed.

1 http://finance.yahoo.com/news/Citigroup-earns-215-billion-apf-1301075638.html?x=0&sec=topStories&pos=main&asset=&ccode=
2 http://www.cnbc.com/id/39718420
3 http://www.cnbc.com/id/39719414
4 http://biz.yahoo.com/c/e.html


***chart courtesy Gecko Software’s Track n’ Trade Pro
Past performance is not necessarily indicative of future results.

Sunday, May 30, 2010

Risks and Benefits of Managed Futures

Welcome to the world of cta managed futures! Before you open your first futures account, there are likely some questions you are asking…..what exactly can I gain from managed futures accounts and what are the risks for investing futures?

There is a substantial risk of a loss in all futures and options trading, no matter who is managing your money, so why try managed futures? Part of the reason some investors may decide that managed futures are a place for them to place their risk capital is that a managed futures fund may offer more diversity for a portfolio.

If you are a new trader and you have read about the risks associated with trading, but decide that despite the risks, you would like to invest in futures – what markets? Straight futures or options? Long options or short?

Some investors may see managed futures as a way to try techniques and a strategy that differs from their own portfolio efforts and knowledge base. Although, you will want to make sure that the risk tolerance level that the managed futures broker is taking is compatible with yours.

Alternately, a managed futures strategy may be implemented to try to hedge certain positions already in an investment portfolio. Correlated and non-correlated trades may offer a level of diversity that can be potentially beneficial in certain market conditions. However, there are still substantial risks of a loss, no matter what strategy is being used.

For example, an investor who has certain stock portfolios may choose to open an account with a CTA whose managed futures strategies include certain commodities such as livestock or gold, rather than putting all of their risk capital into stocks.

Click to register for free and learn more about the potential benefits – as well as the risks – associated with a diversified portfolio and managed futures!

Trading in futures and options involves a substantial risk of a loss and is not suitable for all investors. Past performance is not necessarily indicative of future results.